


A handy framework of social intelligence
Initialization
The website opening page presented the site theme – we are our choices.
Making choices is an intellectual activity of an individual brain, an effort philosophers call thinking (2) responding to a “call” (1) also originating in the subconscious mind. Our target is confined to the significant sociotechnical system problems we call Category three.
“Thinking” underwrites choice making by comparing the knowledge about candidate fixes to a prioritized value system also held within the individual’s brain (3). Choices made that turn out to be good attest that high-stakes thinking took place. 1 2 3
The theme is so central to our life’s trajectory it is expressly connected to this page:
- Scope of page subject matter
- The logical couplings between theme, the sociotechnical system, and this page
Scope: This page reviews the mathematical physics that, like it or not, determines and shapes social behavior. It is crucially important to avoid any attempt to defy a natural law. If you don’t know the laws to respect and accommodate, the chances you will fail approach 100%. We assume our check list is sufficient because it dependably gets us to Plan B.
Connections: Besides the conservation laws, the laws of control, called control theory, predominate. This set of laws involves the looping of behavior exhibited factored back into the next task action. Control theory determines system stability limits. It is uncanny how dependable crossing those limits brings on system collapse. There is nothing in the rich world of industrial control that is not represented in social behavior, one for one. The mathematical physics are identical. This field was developed over several decades by the Swiss control expert Rudolf Starkermann a key mentor to our Plan B project.
A rack to hang your social experiences on
The prime movers of social behavior have a consistent history running as long as species Homo has existed on our planet. Besides natural laws and context, the stuff that determines particular social behavior during a particular context is coded in our invariant Stone-Age DNA.
In the larger collectives, the drivers of social behavior at a slice in time are not personality-driven. Your unique character does matter in the small group size end of the spectrum, but for the larger collectives, personality plays no role at all. Governments depend upon the baitball-forming instinct of fear to govern. Since governments cannot solve Cat 3 problems, fearmongering is the only control they have.
The expression of social behavior is regulated by conscious-mind intervention and entanglements with the subconscious minds of the collective, e.g., groupthink. The behavior of an individual marooned from society, like Crusoe, when his personal mental equipment is his means for survival is entirely unpredictable. The isolated individual sets one end of the spectrum of social behavior. The other end of the spectrum is bureaucracy, where social behavior is strictly rule-based and entirely predictable – by design.
In between the two extremes are bands of the spectrum where social behavior can be both personality driven and law-driven, impersonal. Within those bands, participants have a choice to use their conscious minds to gatekeep what the subconscious mind is dishing up as imperatives (it always goes first) and do what they think best under the circumstances. The most significant band that pertains to the Cat 3 arena have been identified. It marks the operational realm of Plan B in forging an alliance with the future.
Top Laws channeling social behavior
- Invariant human nature
- Optimality
- 2nd Law
- Control Theory
- Starkermann chart
- Gain
- Feedforward
- 2½ rule
- System/ecological laws
Starkermann’s Corollaries from control theory
It’s vital to commit Stakermann’s basic axioms computed from his work on social system dynamics to memory as a priori truth. His mathematical signs refer to the attitude of an individual towards another. Regarding social action, the minus sign refers to negative feedback, which can be either very good, benevolent, or very bad, hostile. The plus sign refers to aggression, which is feedback indifferent. If the negative feedback is used to destroy the opponent, it’s a declaration of war.
– – hostility; you determine surrender, fast, unconditional, short lived, lose lose
++ aggression; you determine success, fast, unconditional, long lived, win lose
If both parties are aggressive, indifference to feedback leads to the “Friday Night Fights” over a priori truth.When one individual is devoted (-) to the support of an aggressive (+) other.
+ – benevolence; conscious mind thinking + GYAT, judged by others, slow, conditional, success determined by others by performance, win win
Partnerships are either good or bad and unstable. When in a +- relationship, they can produce more than the two sum as individuals. The 2½ rule is not in play. The + person has to think what’s best for goal-seeking (Batman) while the – person has to think of how to assist (Robin).
Continuation
The following set of eight categories of social architecture have been created according to unique behavioral patterns in use. This enables comparison and shows in specifics what Plan B brings to the party on the same framework. All you need to do is count the membership and the hierarchical levels and the map of behavior constrained by that category is exhibited. It works 100% of the time because both human nature and natural law are invariant and indifferent. Dysfunctional organizations (OD) have no way to correct themselves. Plan B organizations are constantly changing themselves for the better as their way of life.
# of individuals in collective 2 # of Levels in Hierarchy 0 or 1 – Partnerships
Factors
- Personalization – Yes
- Group personality ++ = aggression, distrust +- = benevolence, trust; — = war
- Predictability – Yes
- Productivity: ++ = low; +- = high
- Zero sum – no
- Cognitive load: ++ = low; +- = high
- Social status: ++ = domination; +- = performance
- Reality denial/centered: ++ = denial; +- centered
- Workforce health and safety: ++ = low; +- = high
- Producer/consumer driven: ++ = consumer; +- producer
- Inalienable rights: ++ = no; +- = yes
- Outcome responsible: ++ = no; +- = yes
- Highest category of P/S in scope: ++ = 1; +- = 2
Defining characteristics
- Rationality: ++ = no; +- = yes
- OD/corruption: ++ = yes; +- = no
- Transparency: ++ = no; +- = yes
- Creativity – neutral
- Learning – neutral
- Trust: ++ = no; +- = yes
- Resilience: ++ = low; +- = high
- Trajectory: ++ = degradation; +- = prosperity
- Turnover: ++ = unstable; +- low
# of individuals in collective 3-4 # of Levels in Hierarchy 0 – Team
Factors
- Personalization – yes
- Group personality (+-) benevolence
- Predictability – high
- Productivity – high
- Zero sum – never
- Cognitive load – high
- Social status -performance
- Reality centered
- Workforce health and safety – high
- Producer/consumer driven – producer
- Inalienable rights – yes
- Outcome responsible – legitimate yes
- Highest category of P/S in scope – Cat 3
Defining characteristics
- Rationality – rational and prudent
- OD/corruption – impossible
- Transparency – yes
- Learning – yes
- Trust – high stakes
- Win win
- Resilience – high
- Trajectory – progressive success
- Turnover – zero
Commentary
The largest democratic, high performance team size is 4. Adding a fifth consumes more effort in communication that he can contribute to team performance. His personality and credentials have nothing to do with it. The 2½ rule is not in play.
# of individuals in collective 3-10 # of Levels in Hierarchy 1
Factors
- Full personalization – depends
- Group personality (+-) – various
- Predictability – depends
- Productivity – withheld efficiency
- Zero sum – possible
- Cognitive load – low
- Social status (Auth/Perf) – various
- Reality denial/centered – various
- Workforce health and safety – various
- Producer/consumer driven – various
- Inalienable rights – no
- Outcome responsible- no
- Highest category of P/S in scope – 2
Defining characteristics
- Rationality – various
- OD/corruption – possible
- Transparency – depends
- Learning – not likely
- Trust – distrust depends
- Resilience – low
- Trajectory – degradation or success
- Turnover – depends
Commentary
This attribute profile is typical for a small business situation. If the owner is prudent, things can go well. If not, he’s headed to bankruptcy. The shameful record of small business failures testifies to the social intelligence of the owner. The 2½ rule is not in play.
# of individuals in collective 4-10 # of Levels in Hierarchy 1 Master/Apprentice
Factors
- Personalization – yes
- Group personality: +- benevolent
- Predictability – very high
- Productivity – high
- Zero sum – never
- Cognitive load – high
- Social status – performance
- Reality centered
- Workforce health and safety – yes
- Producer/consumer driven – producer
- Inalienable rights – yes
- Outcome responsible – yes legitimate
- Highest category of P/S in scope: 2
Defining characteristics
- Rationality – yes
- OD/corruption – impossible
- Transparency – yes
- Trust – high stakes
- Win win
- Learning – high
- Resilience – moderate
- Trajectory – goal attaining
- Turnover – low
Commentary
The long commendable record of the master/apprentice social arrangement is a testament to social intelligence. It had to succeed to keep the guilds in business and their reputation as worthy servants to society. Its principles are the fabric of Plan B. The 2½ rule is not in play.
# of individuals in collective 11-60 # of Levels in Hierarchy 2
Factors
- Personalization – spotty
- Group personality (+-) and (++)
- Predictability – sensitive to disturbance
- Productivity – moderate
- Zero sum – spotty
- Cognitive load – moderate
- Social status (Auth/Perf) – mixed
- Reality denial/centered – mixed
- Workforce health and safety – moderate
- Producer/consumer driven – mixed
- Inalienable rights – spotty
- Outcome responsible – no
- Highest category of P/S in scope – 2
Defining characteristics
- Rationality – depends
- Learning – depends
- OD/corruption – possible
- Transparency – depends
- Trust – depends
- Resilience – moderate
- Trajectory – unpredictable
- Turnover – low or high
Commentary
This category covers the owner and his foremen. It’s right at the edge of the 2½ rule. Its success is dependent on the social intelligence of the owner/keystone first and second upon that of his foremen. Smart owners train their foremen to be benevolent. Drive management doesn’t work. These social systems are in the zone where particulars matter to predictability.
# of individuals in collective 60-600 # of Levels in Hierarchy 3-4, Plan A
Factors
- Personalization – no
- Group personality – ++ aggressive
- Predictability – yes
- Productivity – 25% efficiency withheld
- Zero sum – yes, illegitimate
- Cognitive load – low, rule-based
- Social status – Authority, domination
- Reality – denial
- The 2½ rule is in effect
- Control by hindsight and fear
- Workforce health and safety – oblivious
- Producer/consumer driven – consumer
- Stakeholder oblivious
- Outcome responsible – no
- Highest category of P/S in scope – 2
Defining characteristics
- Rationality – irrational, imprudent
- Learning – discouraged
- Class-based groupthink
- OD/corruption – yes
- Transparency – opaque
- Trust – provisional distrust
- Creativity – discouraged
- Resilience – no
- Trajectory – degradation
- Turnover – high
- Inalienable rights – no
- All losers
- Positive reciprocity – impossible
- Competitive advantage – no
Commentary
This category of social architecture is where Plan A first manifests as the only ideology in use. Variety and amalgams are no more. Trajectory predictions are reliable. Members are depersonalized, opening the door to Ca’canny, dysfunction, and corruption. Baitball controlled.
# of individuals in collective 700 – 7,000,000 # of Levels in Hierarchy 5-30, Plan A
Factors
- Personalization – no
- Group personality ++, domination
- Predictability – yes
- Productivity – at least 25% efficiency withheld
- Zero sum – yes, illegitimate, lose lose
- Cognitive load – low
- Social status – Authority
- Reality denial
- Control by hindsight, crisis response, rule based
- Workforce health and safety – oblivious
- Stakeholders interests – oblivious
- Entitled consumer driven
- The 2½ rule is in effect
- Inalienable rights – no
- Outcome responsible – no
- Highest category of P/S in scope – 2
Defining characteristics
- Rationality – no, imprudent
- Learning – discouraged
- Reductionism
- OD/corruption – unavoidable
- Creativity – discouraged
- Transparency – opaque
- Distrust, skepticism
- All losers
- Resilience – none
- Trajectory – progressive degradation
- Turnover – high
Commentary
In working with the models of social behavior developed by Rudolf Starkermann, it became clear decades ago that there was a collective size and hierarchical layers where changes in social behavior no longer varied as a function of increasing collective size. That is, changes can be made to the variables and no change in collective behavior takes place. Bureaucratic behavior, for one example, is the same around the globe. Not even war makes a difference. Personalities play no functional role. Many of the plots of performance data shows an asymptote of a curve is a line such that the distance between the curve and the line approaches zero as one or both of the x or y coordinates tends to infinity. Too big to fail also means too big to get better. Sooner or later the 2nd Law prevails.
# of individuals in collective 250-2500 # of Levels in Hierarchy 1 and 2-15 – Plan B
Factors
- Workforce personalization – yes
- Group personality: +- benevolence
- Predictability – highest
- Productivity – highest
- Zero sum – no
- Cognitive load – high, continuing
- Social status – performance
- Reality centered
- Stakeholder interests included
- Workforce health and safety – emphasized
- The 2½ rule is in effect
- Producer driven
- Inalienable rights – yes
- Outcome responsible – legitimate
- Highest category of P/S in scope – 3
Defining characteristics
- Rationality and prudence – yes
- Learning – yes, hyperlearning
- System think, no reductionism
- OD/corruption – impossible
- Transparency – emphasized
- High stakes trust
- Creativity, encouraged
- Cooperation and collaboration
- Resilience – extraordinary
- Control by foresight
- Trajectory – flourishing
- No losers, win win
- Turnover – background level
- Positive reciprocity
- Competitive advantage
Commentary
This profile of Plan B speaks for itself. Notice the patterns of factors correlated with a flourishing organization. While correlation does not prove causation, running a test on a Plan B organization to establish causation is simplicity itself. Just change the variable spotlighted and track the consequences to the system. Since this is a psychological phenomenon, zero inertia, you’ll have your answer promptly after you try to make the change and collide with the Nash Equilibrium.
The analytical case
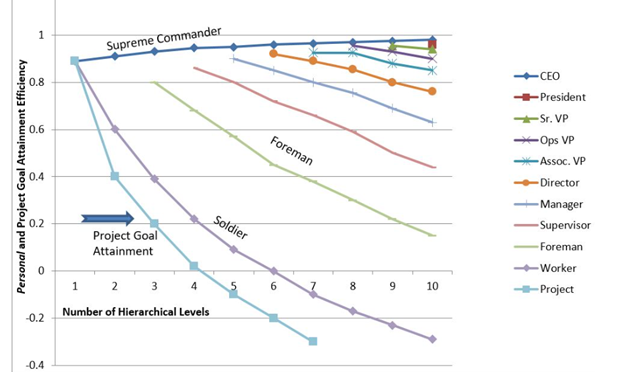
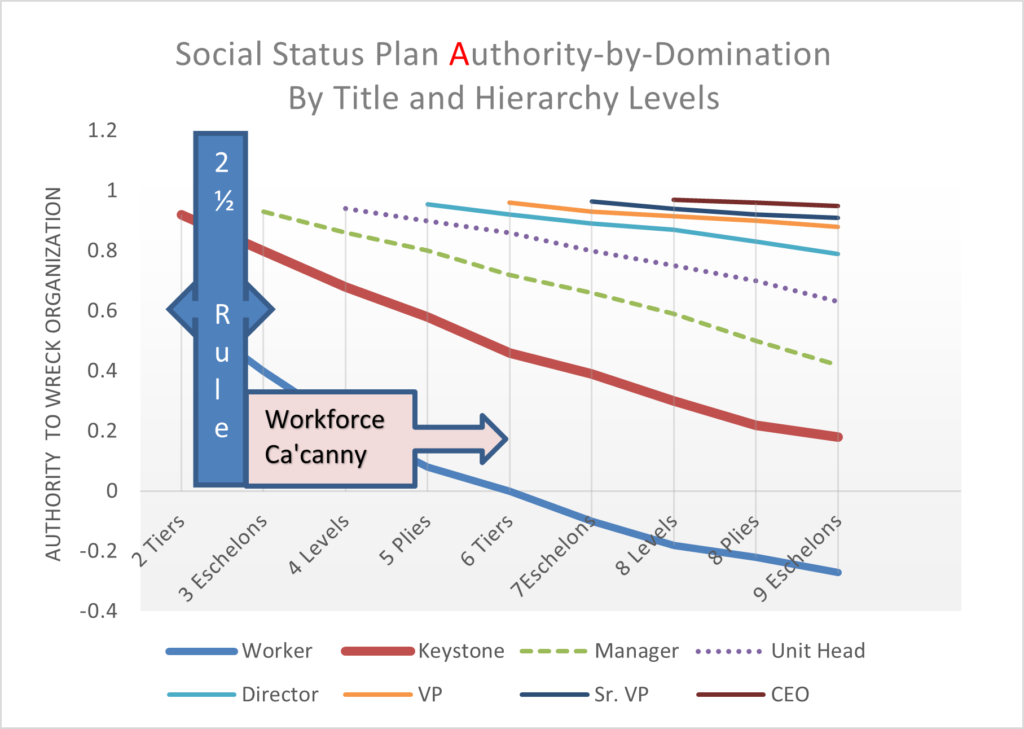
This graph was forty years and thousands of simulator runs in the making. Rudolf Starkermann started on this with mainframe computers at the University of New Brunswick, CA in 1962 and finished on an Apple desktop in 2002 Switzerland. The work involved was described in his 2007 book on social hierarchy in Swiss German.
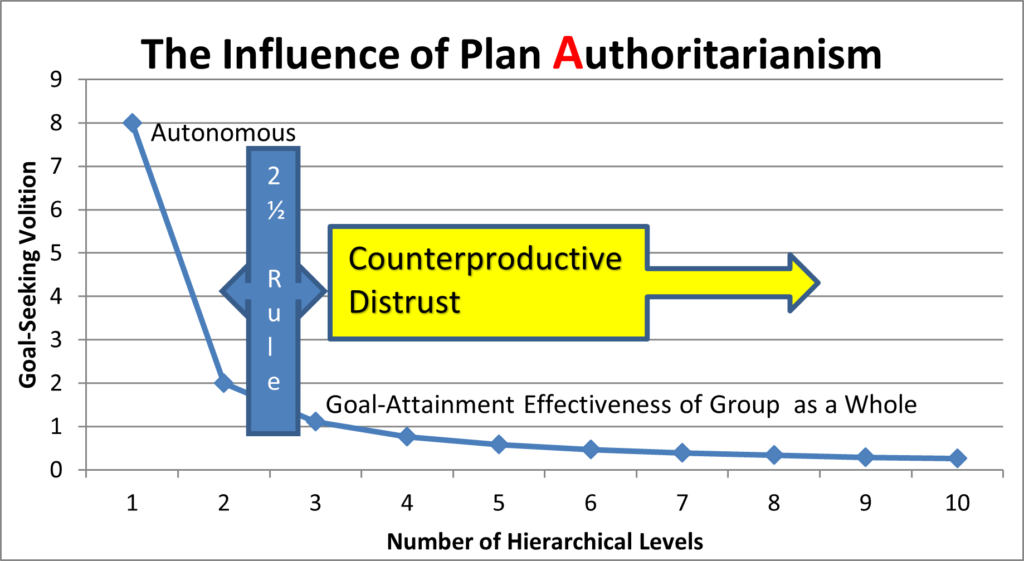
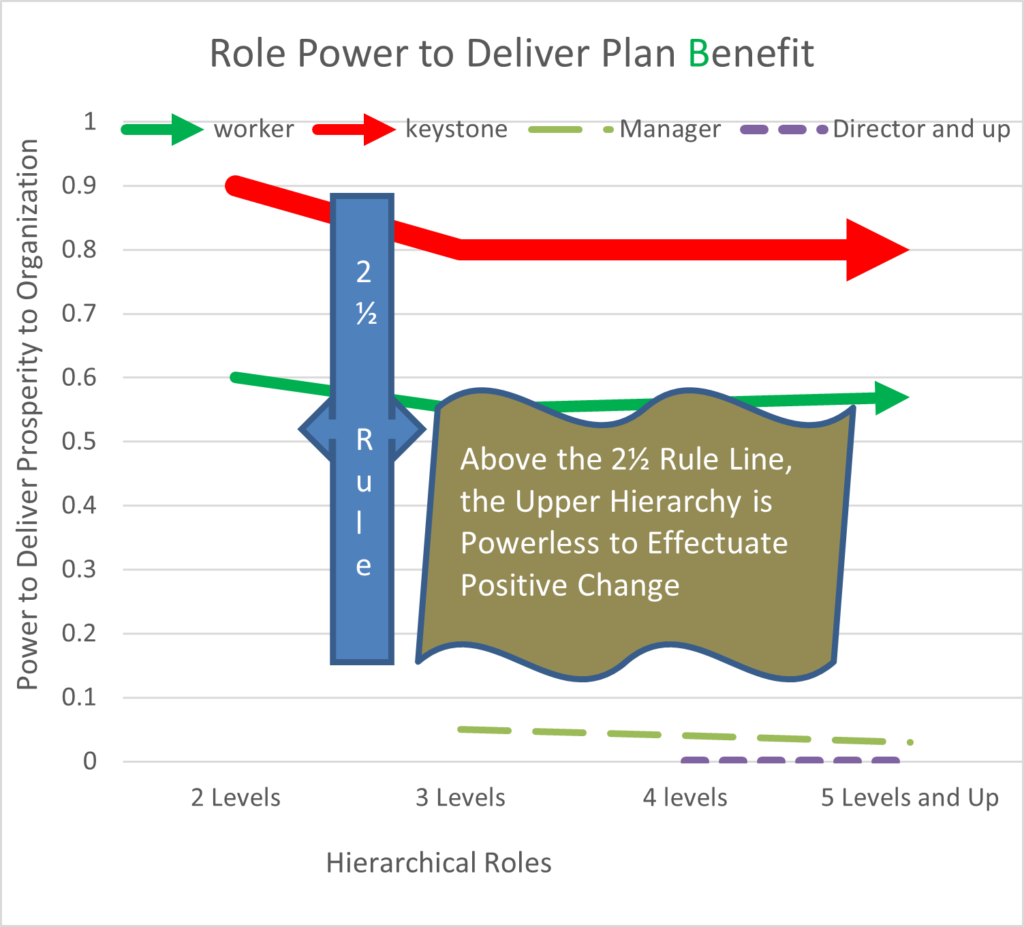
The graph shows the relationship of authority and performance as a function of the number of hierarchical levels in the collective. It shows the authoritative power of the CEO always increasing as levels are added and it shows the opposite trend for everyone else. For the workforce, the drop in authority as levels above two are added is precipitous. This dropoff is always attended with the withholding of efficiency called Ca ’canny. Everyone has experienced this trauma. The day a merger or acquisition is announced, work stops altogether.
As you can see, project goal-seeking and problem solving takes a big hit as hierarchy is increased. The invitation for corruption goes out in all directions. Seen as a betrayal, it happens fast. Corruption temporarily stabilizes things. This graph shows the engine of class distinction in vivid terms. The bottom rungs get murdered while the upper tiers suffer little inconvenience when the CEO adds another level to the heap to his personal benefit.
Your subconscious mind is well aware of this graph. It is used to keep you from being exiled. It’s best for you to bring this graph into your consciousness because, unlike your subconscious, you can use it to predict the trajectory with full confidence. For example, a Plan A organization can only progressively degenerate. A master/apprentice social system cannot fail.
Visits: 74